SOC Automation Project Part 3
- Souleymane Diallo
- Jan 23
- 4 min read

Updated: Jan 27
Acknowledgment: The success of this project was significantly enhanced by the guidance and resources available on the MyDFIR YouTube channel. Their detailed tutorials and expert insights played a crucial role in shaping the development of this lab.
Lab Objective:
The objective of this lab is to configure both Hive and Wazuh servers and integrate a Windows 10 client reporting into Wazuh.
Skills Learned:
Configuration of Cassandra, Elasticsearch, and Hive services.
Wazuh setup and agent installation.
Troubleshooting service issues and optimizing Java settings for Elasticsearch.
Tools Used:
Hive
Cassandra
Elasticsearch
Wazuh
Windows 10
Step-by-Step Lab Instructions
Part 1: Configuring the Hive Server
Cassandra Configuration
Open the Cassandra configuration file:
nano /etc/cassandra/cassandra.yaml

Update the cluster_name to "solo":
cluster_name: 'solo'

💡
Use Ctrl + W to search within the nano editor
Modify the listen_address and rpc_address to the Hive's public IP (replace with your IP):
listen_address: 159.223.131.177
rpc_address: 159.223.131.177


Update the seeds to your public IP:
seeds: "159.223.131.177:7000"

Save and exit the file (Ctrl+X, Y).

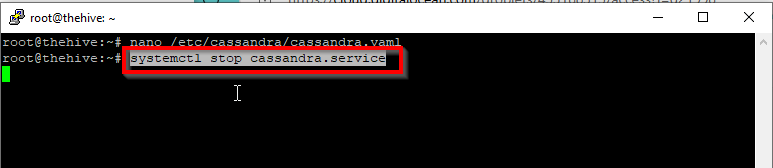
Restart Cassandra
Stop the Cassandra service:
systemctl stop cassandra.service
Remove old Cassandra files:
rm -rf /var/lib/cassandra/*

Start the Cassandra service:
systemctl start cassandra.service

Verify it’s running:
systemctl status cassandra.service


💡
Press 'q' to exit the status screen and return to the command prompt.
Part 2: Configuring Elasticsearch
Edit Elasticsearch Configuration
Open the configuration file:
nano /etc/elasticsearch/elasticsearch.yml

Update the cluster.name to "thehive":
cluster.name: thehive


Set the network.host to your public IP:
network.host: 159.223.131.177

Uncomment the default HTTP port (9200):
http.port: 9200

To initiate Elasticsearch, it requires either a discovery seed or a designated cluster initial master node. For this configuration, we will opt for the latter approach.
Uncomment & Update the cluster.initial_master_nodes:
cluster.initial_master_nodes: ["node-1"]

Save and exit the file.

Start Elasticsearch
Start and enable the Elasticsearch service:
systemctl start elasticsearch
systemctl enable elasticsearch


Check the status:
systemctl status elasticsearch.service


Let’s check the status of Cassandra to make sure it is running as it stop sometimes. Upon checking we see that it is running
systemctl status cassandra.service

Part 3: Configuring Hive
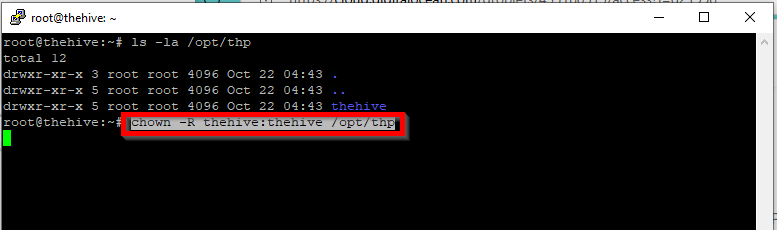
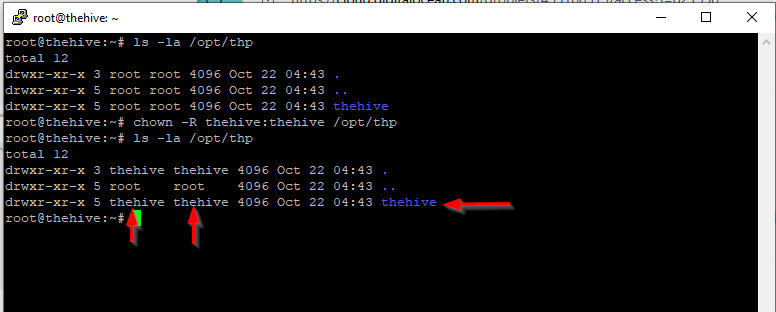
Set Directory Permissions
Verify Hive user and group have access to a certain file path:
ls -la /opt/thp

Ensure Hive user and group have access to thehive directory:
chown -R thehive:thehive /opt/thp
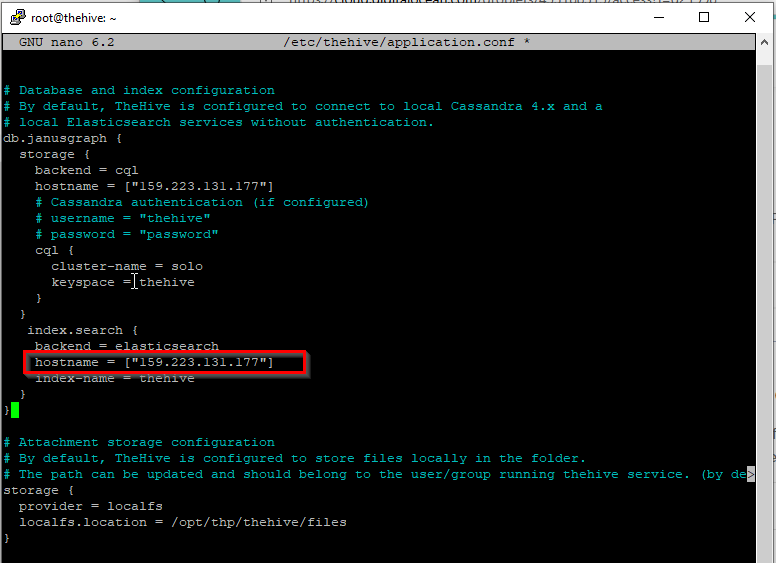
Edit Hive Configuration
Open the Hive configuration file:
nano /etc/thehive/application.conf

Under Database and index configuration, update the hostname to your public IP:
hostname = ["159.223.131.177"]

Set the cluster-name to match Cassandra:
cluster-name = solo

Scroll down a bit and in theindex.search, update thehost.name to your public IP:
host.name = "159.223.131.177"
Scroll down and in theService configuration, update the application.baseUrl to your public IP:
application.baseUrl = "http://159.223.131.177:9000"

Save and exit the file.

💡
By default, TheHive integrates both Cortex and MISP. Cortex serves as a powerful tool for data enrichment and automated response capabilities, while MISP functions as a robust Cyber Threat Intelligence (CTI) platform. These integrations enhance TheHive's ability to process, analyze, and respond to security incidents effectively.

Start Hive
Start and enable the Hive service:
systemctl start thehive
systemctl enable thehive


Verify the service status:
systemctl status thehive.service


Part 4: Troubleshooting Services
💡
If you encounter difficulties accessing TheHive, it's crucial to verify the status of all three essential services: Cassandra, Elasticsearch, and TheHive itself. These services are interdependent, and TheHive will not function properly unless all three are running smoothly. Follow the steps below to check and ensure each service is operational.
Check Cassandra:
systemctl status cassandra.service

Check Elasticsearch:
systemctl status elasticsearch.service

Check Hive:
systemctl status thehive.service

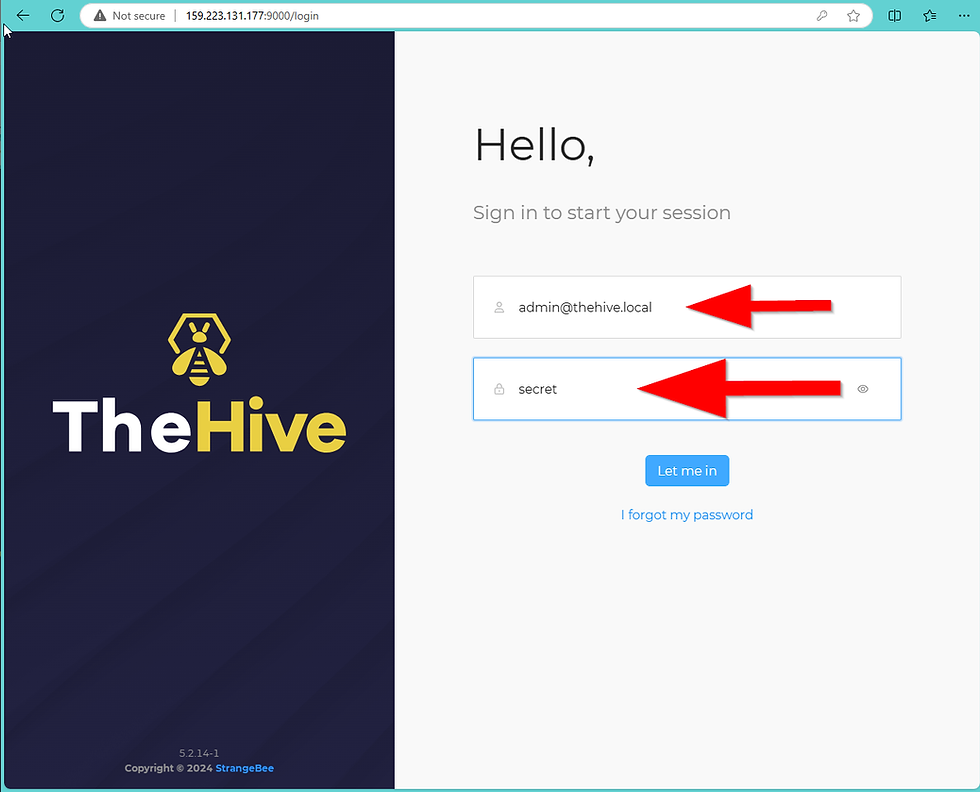
Part 5: Accessing the Hive
Access Hive using your browser:
URL: http://[your public IP]:9000

Use the default credentials:
Login: admin@thehive.local
Password: secret
💡
If you encounter errors accessing ‘thehive’, check ‘elasticsearch’ status. If the status indicates 'failed', you may need to create a custom JVM options file to resolve the issue.


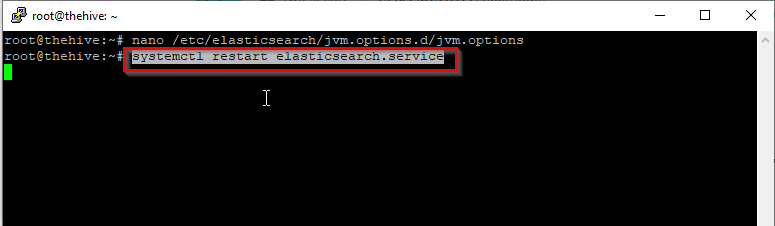
Create a Custom JVM file:
nano /etc/elasticsearch/jvm.options.d/jvm.options

Add the following content and save:
-Dlog4j2.formatMsgNoLookups=true
-Xms2g
-Xmx2g

Restart Elasticsearch and check status:
systemctl restart elasticsearch.service


Login to thehive


Part 6: Configuring Wazuh
Login to Wazuh Dashboard
Open a web browser and navigate to https://<your-wazuh-public-ip>. Use the administrative credentials retrieved in part 2.


Extract Wazuh Installation Files
If you're unable to log into the Wazuh dashboard, first verify the presence of the 'wazuh-install-files.tar' file by running the 'ls' command in your terminal. This file should be available if you initially downloaded Wazuh using the curl method.

Run the following commands:vv
tar -xvf wazuh-install-files.tar
cd wazuh-install-files
cat wazuh-passwords.txt


Note the admin password and Wazuh API user password.

Add Windows Agent
In the Wazuh dashboard, click "Add Agent", select Windows, and enter the server address (your public IP). Below it, enter “solo” as the agent name and leave “existing groups” as Default.


Copy the command below and run it in Windows PowerShell with admin privileges.
Invoke-WebRequest -Uri https://packages.wazuh.com/4.x/windows/wazuh-agent-4.7.5-1.msi -OutFile ${env.tmp}\wazuh-agent; msiexec.exe /i ${env.tmp}\wazuh-agent /q WAZUH_MANAGER='159.65.248.250' WAZUH_AGENT_NAME='solo' WAZUH_REGISTRATION_SERVER='159.65.248.250'

Start the Wazuh service:
net start wazuhsvc

Verify Wazuh Agent
In the Wazuh dashboard, confirm the Windows agent is active.

End of Lab
You’ve successfully configured both Hive and Wazuh servers, and integrated a Windows 10 client. The next step will be generating telemetry to detect Mimikatz usage on the Windows client.
Summary
In this lab, you configure Hive and Wazuh servers, along with integrating a Windows 10 client reporting into Wazuh. The process involves setting up and customizing the configurations for Cassandra and Elasticsearch services, adjusting file permissions for Hive, and ensuring all services are running correctly. You then access the Hive dashboard, troubleshoot potential issues with Elasticsearch, and finally install and activate a Wazuh agent on a Windows machine. This setup enables future monitoring and detection of suspicious activity, like Mimikatz usage, in a Windows environment.


Comentarios