SOC Automation Project Part 4
- Souleymane Diallo
- Jan 23
- 8 min read

Updated: Jan 27
Acknowledgment: The success of this project was significantly enhanced by the guidance and resources available on the MyDFIR YouTube channel. Their detailed tutorials and expert insights played a crucial role in shaping the development of this lab.
Lab Objective:
The objective of this lab is to generate telemetry data from a Windows 10 machine and configure Wazuh to properly ingest it. You will learn how to configure telemetry for detecting the usage of Mimikatz and create custom alerts for specific events within Wazuh.
Skills Learned
Configuring Wazuh Agent on a Windows machine.
Modifying Wazuh configuration to ingest specific logs (e.g., Sysmon logs).
Creating custom Wazuh rules for alerting on specific events.
Troubleshooting telemetry ingestion and alerts in Wazuh.
Detecting Mimikatz usage via telemetry
Modifying security settings in Windows and Wazuh
Understanding Sysmon and Windows Event Viewer integration with Wazuh
Tools Used
Wazuh: Open-source SIEM for telemetry monitoring
Sysmon: For advanced logging on Windows
Mimikatz: Credential dumping tool for simulating malicious activity
Windows Event Viewer: Verifying sysmon logs
Notepad & PowerShell: Editing and running configurations on Windows CLI
Step-by-Step Instructions
Setting up Wazuh Configuration
When we install Wazuh on a Windows machine, the configuration files are typically located in the Program Files (x86) directory. Specifically, we need to navigate to the "ossec-agent" folder within this directory to access the necessary configuration files.
Navigate to the Wazuh agent directory on your Windows machine: C:\\Program Files (x86)\\ossec-agent.


Open ossec.conf in Notepad with administrator privileges. This file contains configurations related to Wazuh.


Backup the ossec.conf file before making any changes by copying it and renaming it to ossec-backup.

Open ossec.confand scroll to the “Log Analysis” section in ossec.conf:

Copy one of the existing localfile tags, paste it below the application entry.

Currently for the location name, It is set to application and because we want to ingest sysmon logs. Let's change this to sysmon's channel name.
Change the location tag to monitor Sysmon logs. The location should have your Sysmon channel name like this:
<localfile> <location>Microsoft-Windows-Sysmon/Operational</location> <log_format>eventchannel</log_format> </localfile>
To find the Sysmon channel name on your Windows computer, open Event Viewer, navigate to Applications and Services Logs > Microsoft > Windows > Sysmon, right-click Operational, select Properties, and copy the full name.


To enable Sysmon logs ingestion, add the following configuration:

To streamline the ingestion process and focus solely on Sysmon logs, you may opt to remove the existing configurations for application, security, and system logs. This adjustment ensures that only Sysmon events are forwarded to the Wazuh manager. However, if you wish to maintain a comprehensive log collection, you can retain these configurations alongside the newly added Sysmon log entry. For our case, we will remove the existing configurations for application, security, system, and leave out the active response.
Remove the existing application, security, and system logs so only Sysmon logs are ingested.

Save and close the file.

Restart Wazuh Service:
After saving the configuration file, open Windows Services, find Wazuh, and restart the service.

QQ3DQ2F4PWU83h1zm*T96z6IY.mUVvFW
Check for Sysmon events on the Wazuh dashboard, by going under “Events” and making sure that we are in the alert index, start searching for Sysmon events by typing sysmon in the search bar. Keep in mind that it might take some until we can search for some sysmon events.
Set Up Mimikatz and Exclude from Windows Defender
Disable Windows Defender for Mimikatz:
The next thing we want to do is download mimikatz onto our machine. We want to make sure that we disable Windows Defender or at least exclude our downloads folder because it will detect it for sure.
💡
Mimikatz is an application that attackers and red teamers use to extract credentials from a computer.
Open Windows Security and navigate to Virus & Threat Protection.

Select Manage Settings and under Exclusions, add an exclusion for your Downloads folder.


Download Mimikatz
Download Mimikatz from a reputable source and save it to the Downloads folder.
Releases · gentilkiwi/mimikatz
Disable Google Chrome's protection if required to allow the download.


Extract and Run Mimikatz:
Right-click the downloaded file and select Extract All.


Open PowerShell as an administrator, navigate to the Mimikatz directory, and run mimikatz.exeby typing this:
cd C:\Users\solab\Downloads\mimikatz_trunk
.\mimikatz.exe


Open the Wazuh dashboard and search for “Mimikatz” under the alerts index to confirm events are being detected.

You might not see any events related to Sysmon or Mimikatz because Wazuh didn't trigger any rules for those activities. By default, Wazuh only logs events when a rule is activated, so not all activities are recorded. To capture more detailed logs, we can modify the Wazuh manager's ossec.conf file to log everything by default. Additionally, we can create a specific rule to monitor selected events so that when a particular event occurs, Wazuh will trigger an alert, allowing us to search for it. Let's proceed with these configurations.
Configure Wazuh to Log All Events
In the Wazuh manager CLI, navigate to /var/ossec/etc/ossec.conf.
Because mistakes do happen, we want to be able to go back if needed using our backup file. So let’s back up the ossec-conf file by typing :
cp /var/ossec/etc/ossec.conf ~/ossec-backup.conf


Edit ossec.conf using nano by typng:
nano /var/ossec/etc/ossec.conf

Editor the ossec.conf and set <logall> and <logall_json> to “yes” under <alerts_log> When done, save the it. Essentially this means what format do you want the logs to be displayed in? You can select either or in my case selecting both I'll save this and hit yes.

Restart the Wazuh Manager:
After saving the configuration, restart the Wazuh manager by typing:
systemctl restart wazuh-manager.service

What this configuration does is force wazuh to begin archiving all the logs into a file called “archives”. This file will be located in /var/ossec/logs/archives. we can navigate there by typing the following into wazuh manager CLI like this:
cd /var/ossec/logs/archives
ls
These are the files that will be created and the logs will be placed in her

Enable Archiving in Filebeat:
In order for wazuh to start ingesting these logs, we need to change our configuration in filebeat. To do that, we:
Open /etc/filebeat/filebeat.yml and type in:
nano /etc/filebeat/filebeat.yml

Set filebeat.modules> archives>enabled from false to true for archives, save the file, and restart Filebeat.

Restart filebeat service by typing:
systemctl restart filebeat

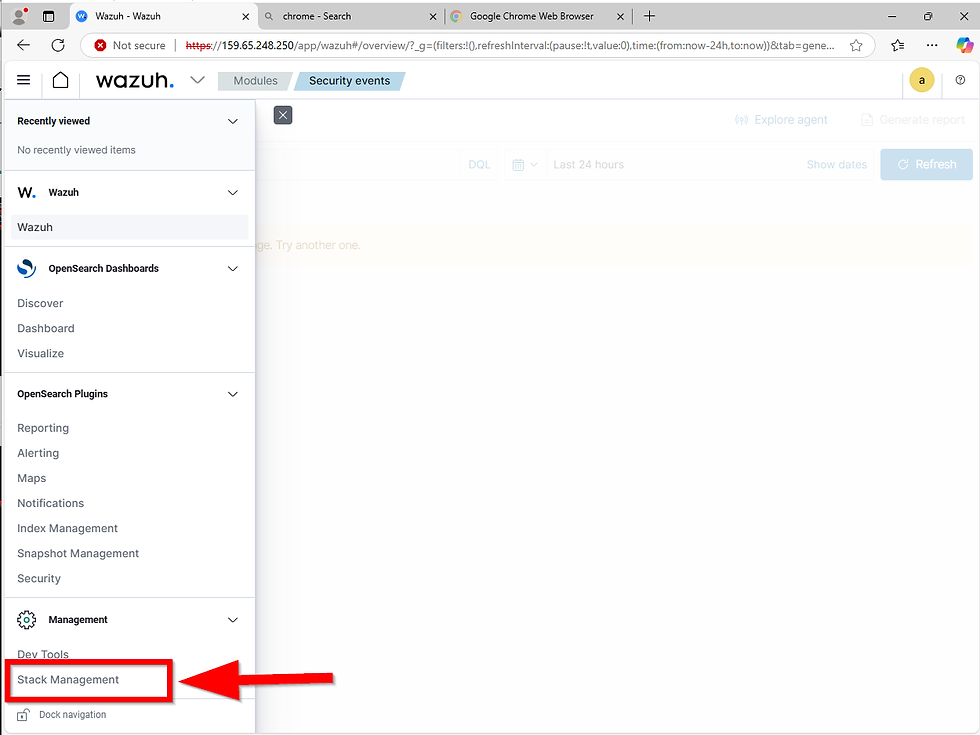
Go to Stack Management > Index Patterns. To access this, click the hamburger icon in the top left corner of the dashboard, scroll down, and select Stack Management. Then click on Index Patterns.

Currently, we have three index patterns:wazuh-alerts-*, wazuh-monitoring-*, wazuh-statistics-*. We’ll add an index for archives so we can search all logs, even if Wazuh hasn't triggered an alert.

To create the wazuh-archives-* index for archived log searches, click on Create Index (the big blue button at the top right). Enter the name and click next
wazuh-archives-*

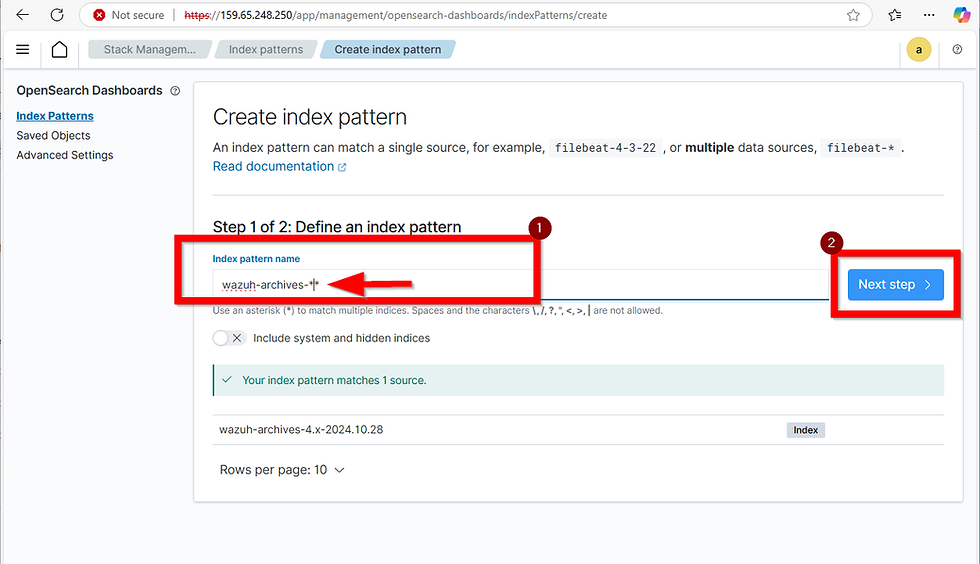
Choose the timestamp as the time field, and then select Create Index Pattern.

Verify Events in the Archive Index:
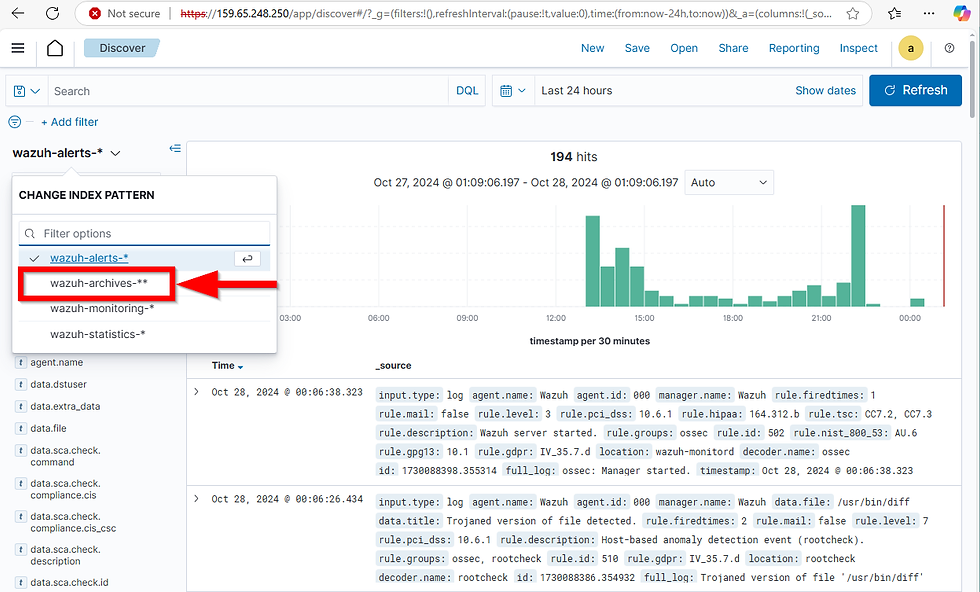
Use Discover on the dashboard. Now let's head back over to “Discover”. We can head over there by clicking on the top left the hamburger icon and just click on “Discover” select the indexes from the drop down arrow and then we want to select our “archives”. Now, it might take a while until events start to flow in, but it will come in eventually, I promise

Now, Wazuh is a bit special. By default, not all logs will show in the manager. In fact, only those that trigger a rule will show up. That is why we had to configure the logs to log everything. Making it so regardless of a rule being triggered or not, we want the manager to archive it and allow us to search for them.
Troubleshooting
In the Wazuh manager CLI, navigate to the following directory:
cd /var/ossec/logs/archives

To view the contents of this directory, type:
ls

Here, you'll see archives.json and archives.log. To check for events in these files, use:
ls -la

Now, to troubleshoot, we can display the contents of archive.json and search for "mimikatz" with a case-insensitive filter by typing:
cat archives.json | grep -i mimikatz

If no Mimikatz events appear, this means none were generated, so they won’t show up on the Wazuh dashboard. In that case, let’s try generating one by running the following in PowerShell:
.\\mimikatz.exe

Afterward, open the Event Viewer to confirm that Sysmon is capturing Mimikatz activity. Look for Event ID 1, which represents process creations. If you see Mimikatz in the Event Viewer, this confirms that Sysmon is generating logs on your Windows machine, and we’ve configured ossec to forward Sysmon data to Wazuh.


Next, return to the Wazuh manager and use the command:
cat archives.json | grep -i mimikatz

If Mimikatz appears in the archive log but not on the dashboard, you can force ingestion by restarting the Wazuh manager service (though avoid this in production). Upon expanding Event ID 1, look at the field labeled "original file name." This field can be used to create an alert, as it retains the original filename even if Mimikatz is renamed, like to “mimicow,” which would bypass other field-based detections. This ensures alerts still trigger on Mimikatz activity, regardless of renaming attempts by attackers.

Creating a Custom Rule for Mimikatz Detection
Wazuh provides built-in rules located in /var/ossec/ruleset/rules, accessible through the Wazuh manager CLI. Fortunately, these rules can also be viewed directly on the dashboard, making it easy to work without needing CLI access.
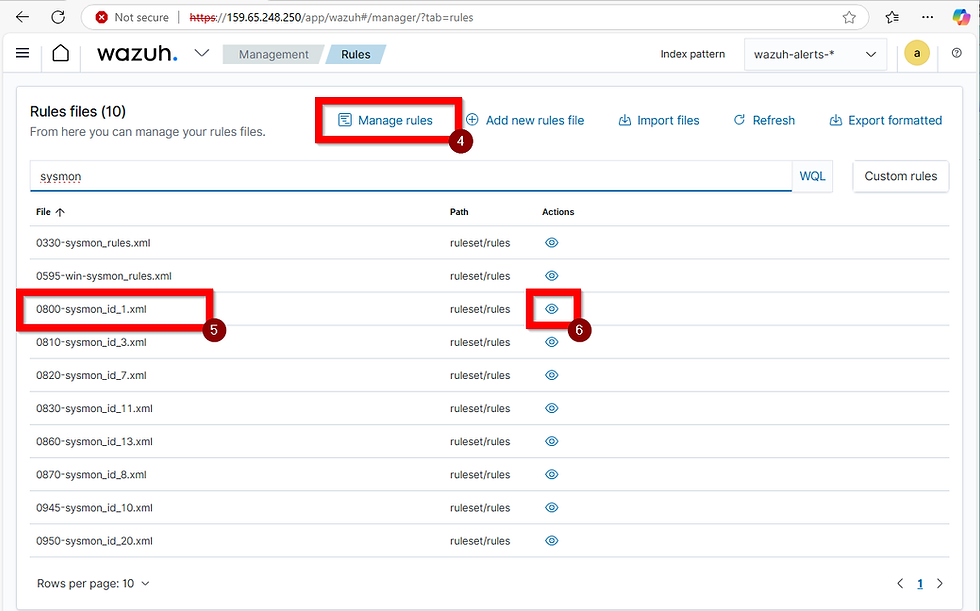
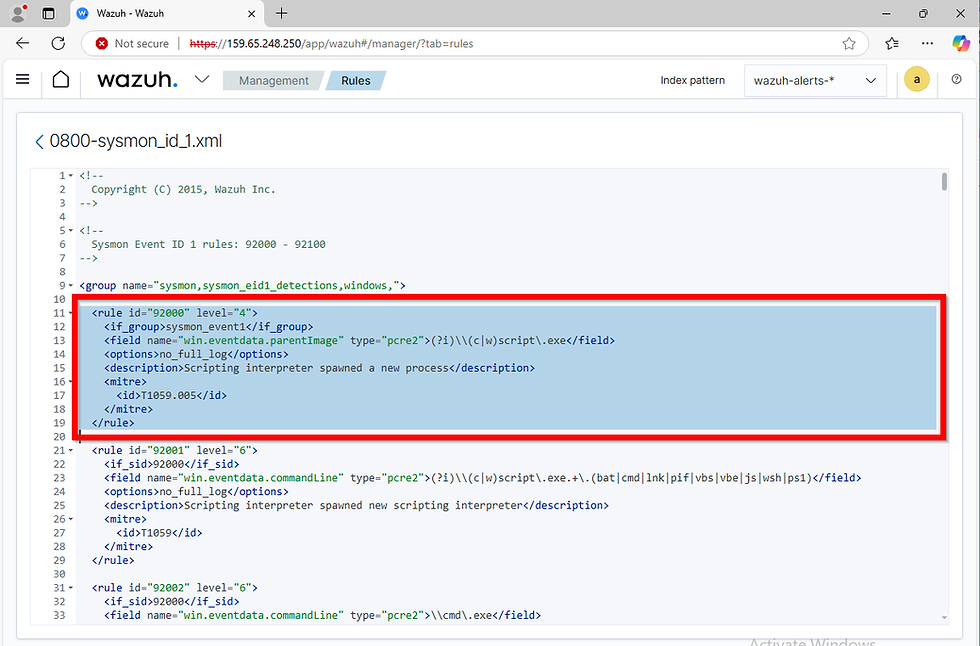
To access rules on the dashboard, click on the Home button, then select Management from the dropdown. In the Management section, click Rules, then Manage Rule Files in the top-right corner. To locate rules specific to Sysmon’s Event ID 1, type “sysmon” and hit Enter. For example, “0800-sysmon_id_1” will appear; click the eye icon to view this built-in rule, which is targeted to Event ID 1. I’ll copy this rule to create a custom one for detecting Mimikatz.
Here's the original rule:
<rule id="92000" level="4"> <if_group>sysmon_event1</if_group> <field name="win.eventdata.parentImage" type="pcre2">(?i)\\\\(c\\w)script\\.exe</field> <options>no_full_log</options> <description>Scripting interpreter spawned a new process</description> <mitre> <id>T1059.005</id> </mitre> </rule>

Now, go to Custom Rules on the dashboard and open local_rules.xml by clicking the pencil icon to edit it. Paste the copied rule just below any existing ones, keeping the indentation and spacing consistent.


To customize the rule, start by assigning a new ID (custom rules IDs begin at 100000). For example, change the ID to “100002” and increase the severity level from 4 to 15 as follows:
<rule id="100002" level="15">
Next, modify the <field> tag to detect “originalFileName” instead of “parentImage” and replace the search pattern to specifically look for “mimikatz”:
<field name="win.eventdata.originalFileName" type="pcre2">(i)mimikatz\.exec</field>
Ensure the field name is case-sensitive. The (?i) ignores case for the field’s value, while “pcre2” specifies regex. I’ll also remove <options>no_full_log</options> to enable full logging and update the description to “Mimikatz Usage Detected”. Lastly, update the MITRE ID to T1003, which indicates credential dumping:
<description>Mimikatz Usage Detected</description>
<mitre>
<id>T1003
</id> </mitre>

Here’s the final customized rule:
<rule id="100002" level="15"> <if_group>sysmon_event1</if_group> <field name="win.eventdata.originalFileName" type="pcre2">(?i)mimikatz\.exe</field> <description>Mimikatz Usage Detected</description> <mitre> <id>T1003</id> </mitre> </rule>
Click on the blue ‘Save’ button and restart the Wazuh manager using the prompt that appears.


Now, to test this, rename Mimikatz to “do_you_notice_me” and run it in PowerShell:
.\do_you_notice_me

Refresh the Wazuh dashboard, scroll down, and the alert should trigger, showing the renamed Mimikatz executable detected by matching the original file name. This demonstrates why monitoring the original file name is crucial—if the alert looked at “image,” renaming would have bypassed detection.


End Lab
This concludes the setup and verification process for monitoring and alerting on Mimikatz activity with Wazuh on a Windows 10 machine. (See part 5 to continue).


Kommentare